92% of New Year's resolutions fail. The reason?
Isolated goals ignore how fitness affects finances, how skills unlock careers, and how habits compound.
A goal graph fixes this — visual architecture shows which objectives fuel others.
 Map out your ambitions, dependencies, and priorities.
# The Power of Goal Graphs
Think of it like a mind map, but with clear cause-and-effect relationships.
Here’s why it works:
1. Kill 3+ Goals with 1 Action
Think about "Internal" and "External" Goals
Good goals serve you first but also create external benefits.
Running daily → Improves health → Boosts confidence → Attracts better social circles.
Most plans miss these cascading benefits.
2. Spot "Leverage Goals"
Sometimes, the path to a goal reveals new ambitions.
For example:
Start running to lose weight → Discover a love for it → Train for a 5K → Aim for a marathon.
A graph lets you dynamically add these new milestones instead of feeling stuck in a rigid plan.
And achievements drive us, humans.
3. What to Do Now vs. Later
Not all goals should be tackled immediately. A graph helps you:
Focus on high-impact, achievable goals now (e.g., daily exercise).
Postpone high-effort, low-urgency goals (e.g., elective surgery when medical tech improves).
This prevents overwhelm and keeps you progressing efficiently.
# How to Create Your Goal Graph
Step 1: Draft Ugly Version with Pen and Paper
Your graph should start with a problem.
Start with "Broke? Overweight?" as root nodes (List all your dissatisfactions)
Root Nodes (problems) - e.g "Broke", "Overweight"
Nodes (goals) – e.g., "Quit Smoking," "Lose Weight."
Edges (connections) – e.g., "Overweight -> Exercise -> Being Fit"
Step 2: Go Digital
Once you have a draft, use tools like:
MermaidChart.com
Diagrams.net (Draw.io) (drag-and-drop editor)
Step 3: Let AI Optimize It
Prompt AI (e.g., DeepSeek Chat) to:
✔ Generate goal graphs from text prompts.
✔ Spot missing connections.
✔ Break big goals into smaller steps.
✔ Suggest new goals and set priorities
Try asking:
Revisit Monthly
- Kill goals that became irrelevant.
- Boost ones with unexpected profits.
Final Thoughts
A goal graph turns vague aspirations into a clear, adaptable roadmap. By seeing how everything connects, you’ll:
Stay motivated (progress is visible).
Work smarter (focus on high-leverage goals).
Discover new opportunities (sub-goals you hadn’t considered).
Try it today—sketch your first graph and see how much clearer your path becomes!
Here you can create a similar diagram yourself: MermaidJS Playground
Here's the Mermaid code if you're curious:
Map out your ambitions, dependencies, and priorities.
# The Power of Goal Graphs
Think of it like a mind map, but with clear cause-and-effect relationships.
Here’s why it works:
1. Kill 3+ Goals with 1 Action
Think about "Internal" and "External" Goals
Good goals serve you first but also create external benefits.
Running daily → Improves health → Boosts confidence → Attracts better social circles.
Most plans miss these cascading benefits.
2. Spot "Leverage Goals"
Sometimes, the path to a goal reveals new ambitions.
For example:
Start running to lose weight → Discover a love for it → Train for a 5K → Aim for a marathon.
A graph lets you dynamically add these new milestones instead of feeling stuck in a rigid plan.
And achievements drive us, humans.
3. What to Do Now vs. Later
Not all goals should be tackled immediately. A graph helps you:
Focus on high-impact, achievable goals now (e.g., daily exercise).
Postpone high-effort, low-urgency goals (e.g., elective surgery when medical tech improves).
This prevents overwhelm and keeps you progressing efficiently.
# How to Create Your Goal Graph
Step 1: Draft Ugly Version with Pen and Paper
Your graph should start with a problem.
Start with "Broke? Overweight?" as root nodes (List all your dissatisfactions)
Root Nodes (problems) - e.g "Broke", "Overweight"
Nodes (goals) – e.g., "Quit Smoking," "Lose Weight."
Edges (connections) – e.g., "Overweight -> Exercise -> Being Fit"
Step 2: Go Digital
Once you have a draft, use tools like:
MermaidChart.com
Diagrams.net (Draw.io) (drag-and-drop editor)
Step 3: Let AI Optimize It
Prompt AI (e.g., DeepSeek Chat) to:
✔ Generate goal graphs from text prompts.
✔ Spot missing connections.
✔ Break big goals into smaller steps.
✔ Suggest new goals and set priorities
Try asking:
Revisit Monthly
- Kill goals that became irrelevant.
- Boost ones with unexpected profits.
Final Thoughts
A goal graph turns vague aspirations into a clear, adaptable roadmap. By seeing how everything connects, you’ll:
Stay motivated (progress is visible).
Work smarter (focus on high-leverage goals).
Discover new opportunities (sub-goals you hadn’t considered).
Try it today—sketch your first graph and see how much clearer your path becomes!
Here you can create a similar diagram yourself: MermaidJS Playground
Here's the Mermaid code if you're curious:
Generate a MermaidJS graph for a "Better Me",
breaking down steps to reach a good life, touching on all aspects of life.

- Add %% comments to prioritize areas

- Use -->|priority| to mark focus areas

- Add completion percentages (e.g., C3[Continuous Learning 75%])

- Create dependencies between nodes to show synergies
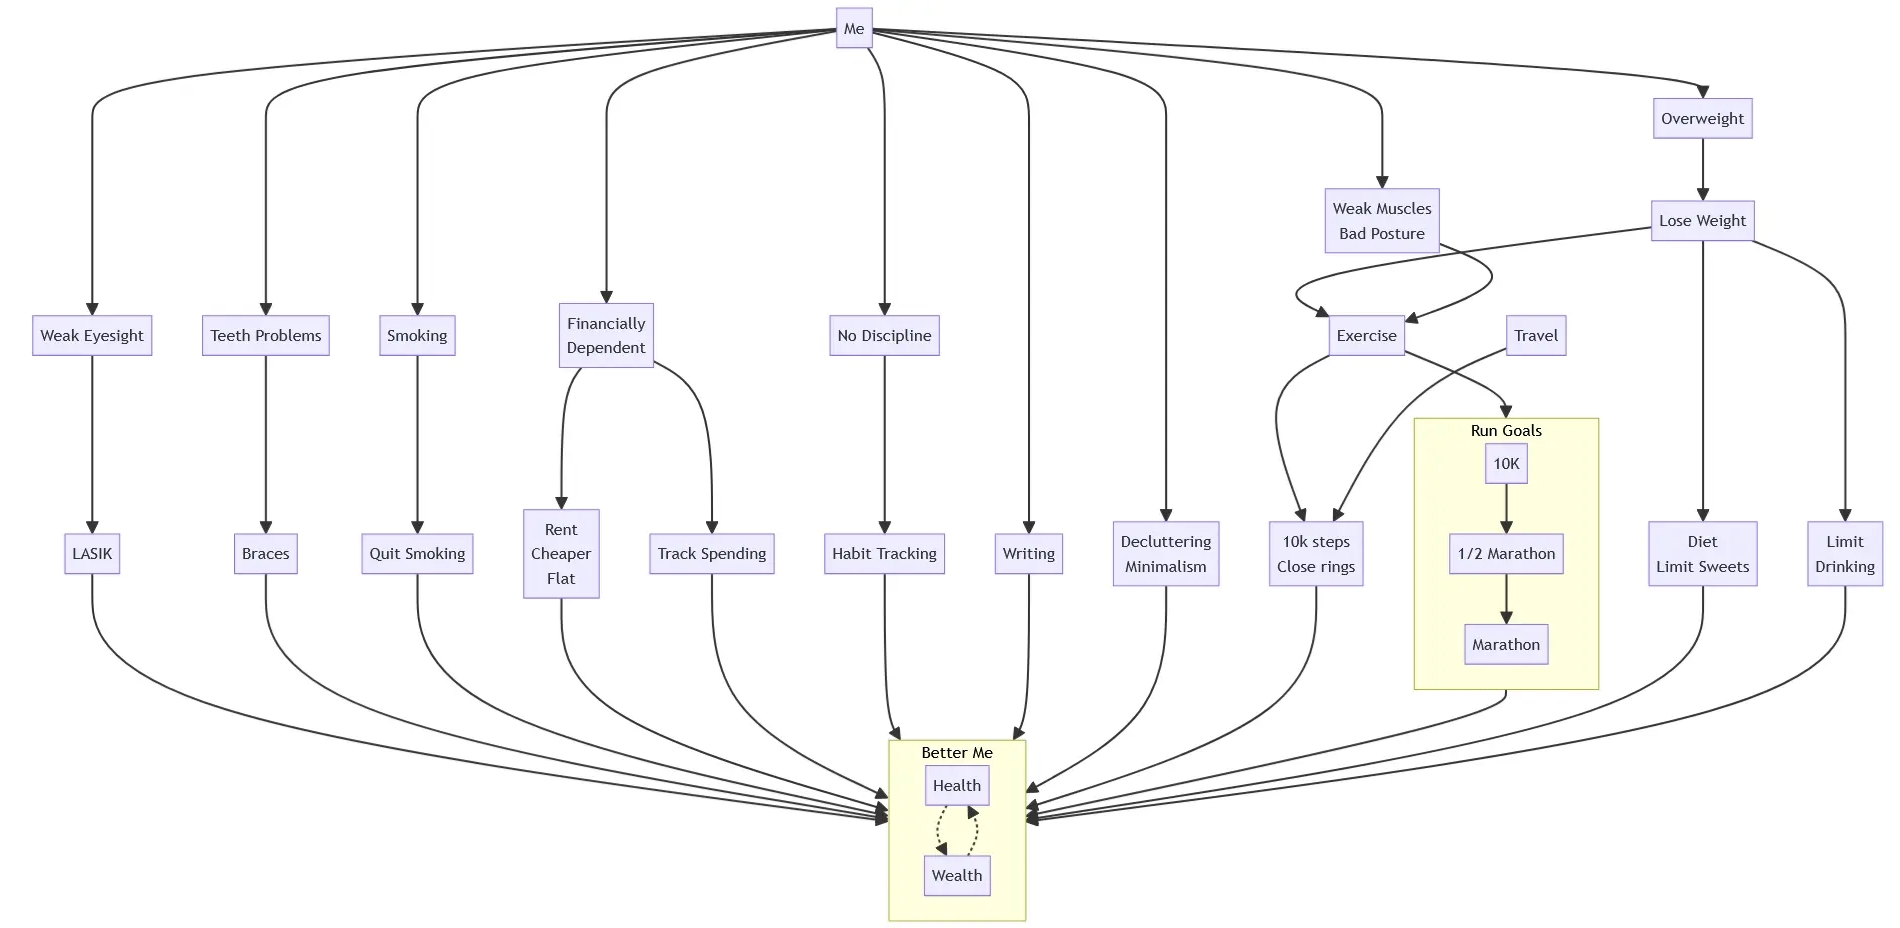
flowchart TD
    subgraph BetterMe["Better Me"]
        Health
        Wealth
    end
    subgraph RunGoals["Run Goals"]
        10K --> HalfMarathon["1/2 Marathon"] --> Marathon
    end

    Me --> WeakEyesight["Weak Eyesight"] --> LASIK --> BetterMe
    Me --> Overweight --> LoseWeight["Lose Weight"] --> Exercise & Diet["Diet\nLimit Sweets"] & Drinking["Limit\nDrinking"]
    Me --> Teeth["Teeth Problems"] --> DentalProcedures["Braces"] --> BetterMe
    Me --> Smoking --> QuitSmoking["Quit Smoking"] --> BetterMe
    Me --> WeakMuscles["Weak Muscles\nBad Posture"] --> Exercise
    Me --> Finances["Financially\nDependent"] --> CheaperFlat["Rent\nCheaper\nFlat"] & TrackMoney["Track Spending"] --> BetterMe
    Me --> NoDiscipline["No Discipline"] --> Habits["Habit Tracking"] --> BetterMe
    Me --> Writing --> BetterMe
    Me --> Minimalism["Decluttering\nMinimalism"] --> BetterMe

    Exercise --> DailySteps["10k steps\nClose rings"] & RunGoals --> BetterMe
    Diet --> BetterMe
    Drinking --> BetterMe
    Travel --> DailySteps

    Health -.-> Wealth
    Wealth -.-> Health